The STDEVP function calculates
the standard deviation for a sample set of data.
Syntax
The syntax for the STDEVP
function in Microsoft Excel is:
=STDEVP( number1, [number2, ... number_n] )
Parameters or Arguments
number1
It is a population number.
number2, ... number_n
Optional. They are the
population numbers. There can be up to 30 numbers entered.
Stdevp Function Example
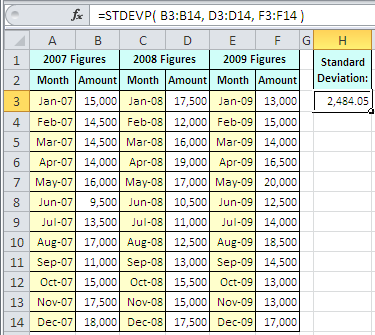
A company keeps a record of
its monthly sales figures, over the last three years. These are stored in cells
B3-B14, D3-D14 and F3-F14 of the above spreadsheet.
The standard deviation of the
three years' sales figures is calculated in cell H3 of the spreadsheet. The
formula for this, (shown in the spreadsheet formula bar), is:
=STDEVP( B3:B14, D3:D14, F3:F14 )
As shown in cell H3, the
standard deviation for the 3 years of sales figures is calculated to be
2,484.05
Other Argument Types
In the example above, the
arguments to the Stdevp function are input as 3 cell ranges. However, you can
also input figures directly, as individual numbers or number arrays.
For example, if, during
January and February 2010 the sales figures are 13,000 and 14,500, you could
add these directly into the above function as follows:
Either as individual numbers:
=STDEVP( B3:B14, D3:D14, F3:F14, 13000, 14500 )
Or, as an array of numbers:
=STDEVP( B3:B14, D3:D14, F3:F14, {13000, 14500}
)
This gives the updated standard deviation value of
2,435.35
Reference:
follow us on http://arivilm.blogspot.in
like us on https://www.facebook.com/Arivilm2501/


No comments:
Post a Comment